Have you ever completed a paint-by-the-numbers painting? All you have to do is paint the assigned color in the numbered zone, and in the end, you’ll have a nice painting. Lets take that philosophy and apply it to VFR Navigation logs.
The Nav-log by the numbers document includes several pages. Pages one and two will be used to make your nav log. Three and Four contain additional information quite important, but not necessary to the creation of a nav log.
Download Nav-log-by-the-numbers.pdf
Download Empty Nav log (Jeppesen)
Download knee-board-sized Navlog
This document serves as a one-stop-shop to making a nav log. This document serves as the practical guide, not the theoretical guide. Both practice and theory are needed for mastery. So, please find below, the amplified explanations for each element.Plot and note True Course with plotter and sectional chart
1 – Plot and note True Course.

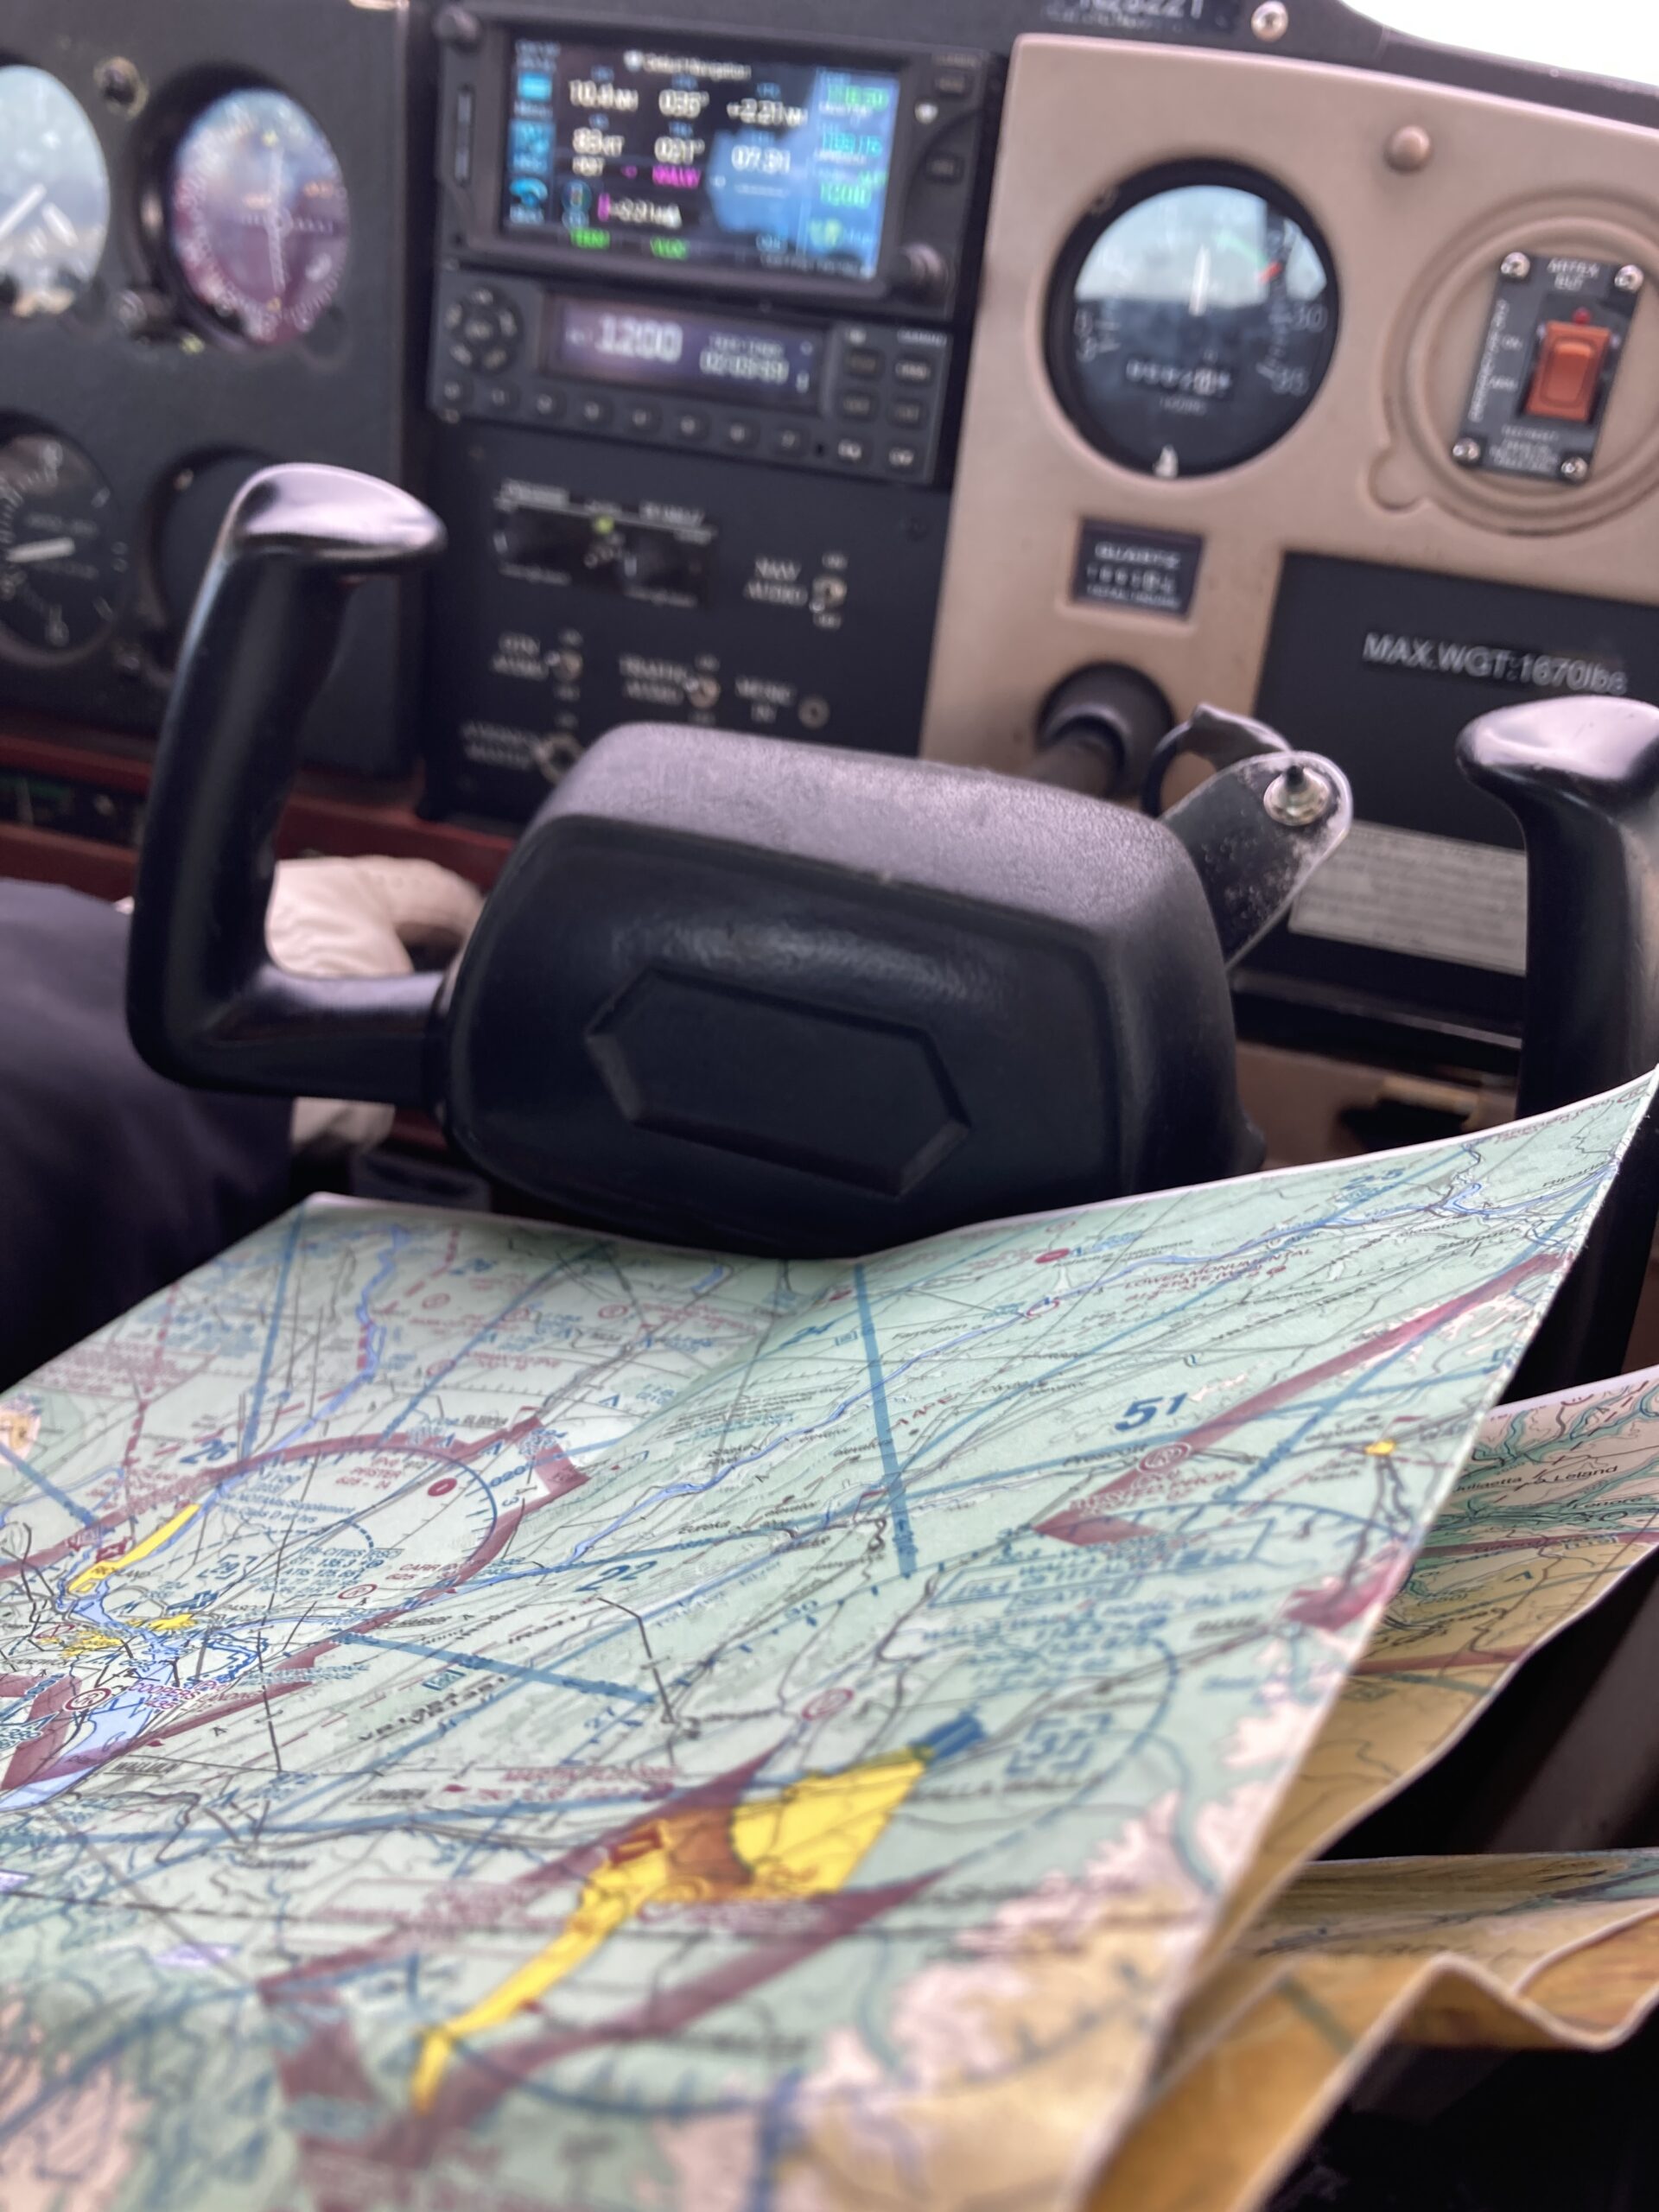
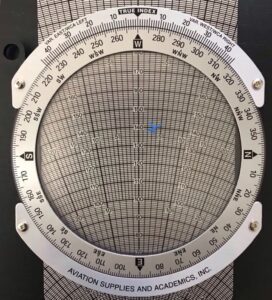
Using a plotter and VFR sectional chart, identify departure and arrival airports. Draw a line between the two along the edge of the plotter. Now, with the plotter still aligned with departure and arrival airports; read true course against lines of longitude
Note to FOREFLIGHT USERS: Steps #1 and #2 are not relevant to Foreflight users. Why? Foreflight will automatically calculate Magnetic course (skipping true course). Bear in mind, if you are using Foreflight map to make your nav-log, it is probably showing magnetic course, not true course. Magnetic course can be found on Foreflight by entering departure and arrival airports in the “FPL” route section (Maps tab > top of the screen “FPL” button > large empty rectangle “Tap here to create a route”), Then tap on the magenta line drawn on the map. When you tap on your magnetic course will be shown.
2 – Magnetic Variation.
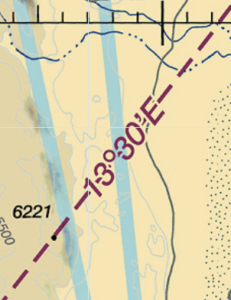
Find magnetic variation written on sectional chart depicted by dashed magenta lines — called Isogonic lines. If our Isogonic line has an E following our magnetic variation number, we call it “easterly variation”, and if a W, we call it “westerly variation”.
Note to FOREFLIGHT USERS: as previously mentioned, this step is irrelevant to Foreflight users, since magnetic course is automatically calculated by Foreflight
3 – Compute Magnetic Course
If we adjust true course for magnetic variation, we will have magnetic course. Now we use the memory aide “east is least, west is best”
meaning we need to subtract easterly variation and add westerly.
4 – Identify and plot Checkpoints
We know the first and last checkpoints have to be our departure and landing airports. We also know right after we leave our departure airport, we will always level off. We call this point the top of climb (T.O.C.). We also know before we arrive at our destination airport, we need to descend! So, before our destination airport we will always have a top of descent (T.O.D.) point depicted.
The points chosen between our top of climb and top of descent we must choose. These checkpoints we will look for in flight. As we pass them, we will note time and speed to predict our time remaining and monitor our fuel consumption.
We dont want points too far apart, we dont want points too close together. A happy middle is 10 or 15 NM. Bear in mind, as you fly longer and longer flights, its possible you may go 30NM between checkpoints. We would like to find points about 10 or 15 NM away when possible.
We want to choose checkpoints that are easy to see from the air. Cities are excelent choices for checkpoints. They are usually pretty big, easy to see, well lit even at night, and often have roads leading in-and-out of them. Cities are depicted as yellow congested areas on sectional charts.
Airports are good checkpoints. Runways can be easy to see and airports usually have lights. Also, knowing where nearby airports are is good for emergency preparedness. Small airports, however, do not make good visual reference points. Typically, its best to avoid using private or grass-strip airports, as they are often small, unlit, and hard to see. Bodies of water are excelent during the day, they reflect light, are large, and have have easily identafiable turns and landmarks (like bridges). At night, a lake will be completely unlit, though, and might not be a good point. Roads, Railway intersections, power lines, power plants, Radio antennas. These make good references aswell, but as said before, consider conditions of flight to determine the viabillity of the visual reference (Low visabilty, Night, cloudiness, fog…)
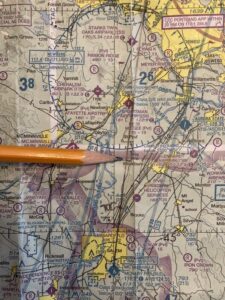
Once points are identified, list them in nav log and use pencil mark to identify them along the course.
Summary of choosing checkpoints: Pick easily visable, ~15NM apart, and if choosing a point abeam your course, consider visibility limits.
5 – Departure Field Elevation
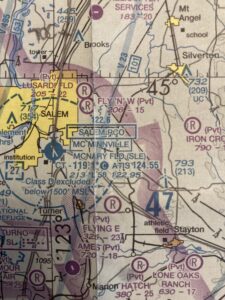
Field Elevation can be quickly found on the VFR sectional. Look for your airport information block. Field elevation is the first italicized number on the bottom row. Field elevation can also be found in the chart supplement.
6 – Arrival Traffic Pattern
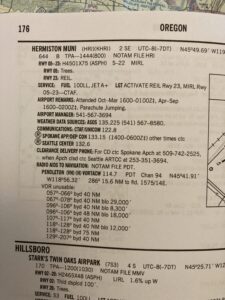
Traffic pattern is usually 1,000 AGL, but not always. For example, some airports, usually smaller and older airports, have traffic patterns at 800 AGL. To find our traffic pattern, open the Chart Supplement to your airports’ page. On the line just below the bold airport name, look for “TPA-xxxx(yyy)”. xxxx value will depict traffic pattern altitude in MSL. This is what we will write in box number 6.
“but wait, the airport I’m going to doesn’t have ‘TPA-….’ written on the chart supplement page!”. When traffic pattern is not specified, it is assumed to be 1,000AGL.
7 – Select Cruise alt Based off magnetic course
The first step in determining our cruising altitude is to comply with 14- CFR 91.159. To remember this regulation, we use the mnemonic, “east is odd, but west is even odder”. If our magnetic course is between 360 to 179, or-east, then we fly at an odd thousand +500 feet. if magnetic course is
between 180 to 359, then even thousand +500.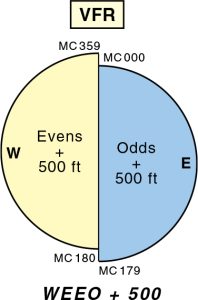
This ensures separation between traffic flying in opposite directions (towards eachother, for example), and IFR traffic.
Other important considerations for selecting altitude is terrain, favorable tailwinds, and cruise performance (will discussed later).
NOTE: This rule only applies above 3,000ft. meaning that aircraft could be flying in any direction, maneuvering, etc. at 3,000ft. This makes 3,000 an undesirable altitude to cruise at. Additionally the atmosphere is quite dense at low altitudes, which gives us poorer fuel economy (we burn more a bit fuel and fly a bit slower).
8 – Calculate Altitude to climb
“Altitude to climb” is the actual distance we will climb.
For example: If we plan to cruise at 8,500 ft MSL, but we depart an airport with a field elevation of 3,000 ft, we will not be climbing eight thousand feet. we will be climbing from field elevation (3,000ft) to 8,500ft. To find out how many feet high we are actually climbing up, we subtract cruise altitude from our field elevation (Cruise ALT – Field Elev. = Alt. to climb)
In our example; departing from 3,000 to 8,500 ft would give us an “altitude to climb” of 5,500ft.
9 – Calculate TOC ETE
We are simply trying to find out how long it will take us to arrive at our cruise altitude.
First, we need to know our rate of climb. refer to the “Maximum Rate of Climb” chart in the POH. We will take the average of our departure through cruise altitudes to find our climb rate.
To find out Estimated Time En-route to our Top of Climb point, we simply divide the “altitude to climb” from the previous step by our climb rate (ALT to climb / climb rate = estimated minutes en route).
NOTE: Many aircraft have “Time and Distance to Climb” charts. This chart does not account for wind, and is not as precise. But, this is a valuable resource. After we calculate the estimated time en-route to our top of climb, the “Time and Distance to Climb” chart is a good place to verify that the number you calculated and the number the manufacturer has are similar. The number we calculated is more accurate, and so we will use it. Its a good idea to “logic check” our number with the POH though just in case we got our math wrong, and came up with a way different number.
Note summary: We can use Time and Dist. to Climb chart just to verify the number we calculated.
10 – Calculate Altitude to Descend
(cruise alt – arrival traffic pattern altitude)
Similar to our climb. We want to know how much altitude we are actually descending from our cruise altitude to the airport, since it is usually not exactly at sea level.
11 – Calculate TOD ETE
(Altitude to Descend / descent rate)
Now, we want to figure out how long it will take us to go from our cruise altitude to our traffic pattern altitude. We will employ the same method as we used to determine how long it will take us to climb. However, our descent rate isn’t based off airplane performance, but rather, we want to base our descent rate off of comfort. 500 feet per minute is a good descent rate. This allows passengers (and pilots too) to pop their ears comfortably as the air pressure changes. So, for most applications, we can just use 500FPM as our descent rate.
(Altitude to descent / 500FPM* = estimated minutes en route)
NOTE: in some extreme cases, high terrain considerations might be applicable, but usually this is not applicable
12 – Copy Winds aloft data
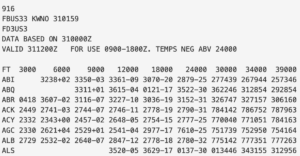
Winds aloft data can be quickly grabbed from AWC or forflight, but will be given in weather briefings. Typically, this is a good time to get a weather briefing, if you haven’t already.
13 – Calculate CLIMBOUT CAS
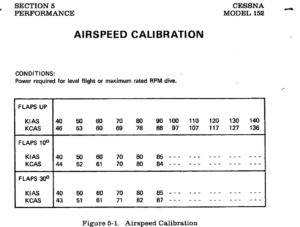
In our climb, we will be flying at Vy*. As we climb, we will be maintaining a constant indicated airspeed of Vy. For our navigation planning we will need to be more precise than using just indicated airspeed. The first step to make our airspeed more precise is to calibrate our airspeed — that is to use our “Airspeed Calibration” chart in our POH.
Example of the Cessna 152:
IAS: 60 70 80
CAS: 60 69 78
This tells us, if our airspeed indicator shows “80 knots”, our calibrated airspeed is actually 78 knots.
In our cessna 152, our Vy is 67(IAS). It happens to be a bit closer to 70(IAS). So, we will use the same “pattern” as 70 knots.
To get CAS when our IAS is 70, we subtract 1 (this is shown, since cas 69, 1 less than 70, IAS). So, to get CAS of our Vy, we will also subtract one, since it is close to 70.
*in some cases, cruise climb could be substituted.
14 – Calculate CLIMBOUT TAS
For our calculations, we need our airspeed to be even more precise, so we will need to find true airspeed (TAS).
To get TAS, we will need to get our weather forcasts (a seperate lesson will cover why TAS is different, we are mainly concerned today with doing the calculation).
Aviation Weather Center has excellent forcasts we can use. AWC has temperature forcasts we will need. Prog charts depict isobars which can give us our pressure information (take nearest Isobar number, and convert it from millibars to inches of mercury to get altimeter setting). Foreflight “daily” forcasts are also great, and contain all the information in one convenient place.
With the weather data, you can plug it into an E6B and get your TAS. King flight schools has excelent tutorials on how to use a rotary E6B.
15 – Obtain Cruise Performance
Cruise TAS is much easier to obtain. It can be found in the POH’s cruise performance chart.
Many cruise performance charts have above and below standard temperature columns. To determine which column to use, we much identify standard temperature at our altitude. To identify standard altitude, it can help to draw out, starting from sea-level, the 2 degree per thousand feet lapse rate. “Standard temperatures aloft sketch:”
etc…
4,000 – 7
3,000 – 9
2,000 – 11
1,000 – 13
SL- 15
So, take whats standard, compare it to the winds aloft data, and determine which column the actual temperature is closest to.
By this point, altitude is already chosen, so cruise data has been narrowed down to a pressure altitude (again, pressure altitude can be calculated in advance using weather forcasts like a prog chart or forflight daily forcast). Now within the narrowed-down area, the option still remains: What RPM setting will the flight be flown with?
RPM is selected primarily based on desired fuel economy. Its simple, if youd like to save fuel, go with a slightly lower RPM setting and fly slower. If your OK with burning more fuel, you’ll get there faster.
With RPM setting selected, BHP, KTAS, and GPH are now apparent.
We can now carry over the TAS and GPH from our POH onto our navlog.
NOTE: When an aircraft has an overhauled, rebuilt, or new engine, the manufacturer usually advises cruising at a specific BHP settting within the first “so many” hours of operation with that engine. Brake horse-power is not usually a concern unless you’ve got a new engine to nurse.
16 – Calculate Groundspeed and WCA
Using an E6B, find groundspeed and wind correction angle (WCA). Its beyond the scope of this article to teach how use this calculator (Youtube video here). Simply using the calculator will give you the correct answer.
17 – Calculate Distance Traveled
Now using our Groundspeed and time, its a simple matter to use our E6B and find our distance. Just like on the knowledge test, “if we fly X fast, and for Y long, how far will we have traveled?”
Be sure to plot the T.O.C. point along your course from your departure with a pencil mark.
18 – Calculate Distance Traveled
Same as previous step, now we need to plot our top of descent from our arrival airport.
19 – Measure Remaining Distances
Using plotter, measure and note distances between each point.
Its a good idea to round distances to the nearest tenth (X.Y)
20 – Calculate Estimated Time En-route
Calculate ETE using E6B.
It is a good idea to round up to the nearest minute with your ETE’s
22 – Calculate Fuel consumed
For our enroute and descent legs, we can simply use our cruise fuel burn rate previously retrieved from our cruise performance table (from the POH) and our time using an E6B.
23 – Add up total distance
No matter how good your mental math is, it always pays to double check with a calculator. Also, Logic check with your plotter. Foreflight and skyvector also have handy computer generated distance measurements, another good backup to “logic-check” against.
24 – Add up total time
Total up the flight time. Logic check this with our distance; “does it really take us 3 hours to travel 56 NM?”
25 – Add up total Fuel CONSUMED
Simple addition. Logic check with time. “would we really burn 25 gallons during a 32 minute flight in our Cessna 152?”
this is the fuel we will actually burn in the airplane
26 – Fuel Reserve
How much extra fuel do we want to carry? We call this extra fuel we dont want to use, reserve. We will avoid “dipping into” our reserves in flight, but we want to plan to have this extra layer of safety in our flight. 14 CFR 91.151 tells us we need addition 30 minutes worth of fuel (at normal cruise burn-rate) in day VFR and 45 minutes at night.
Also, consider possible flight school / aircraft rental company Standard Operating Procedures (SOPS).
Lastly, consider your own personal minimums. How comfortable are you flying into this area? Is it a marginal night-flight? Is your flight taking you to a remote area? Personal minimums –and common sense– are great ways to enforce safe descision making. A future lesson is needed about personal minimums.
27 – Total Fuel To Carry
Fuel Consumed+Fuel reserve = total to carry
This is the total amount of fuel we want in our tanks before we depart. This includes the fuel we calculated that we will burn, and the fuel we have as a backup, that we do not want to use.
27 – Total ROUND TRIP
If you are flying a round trip. EX. THERE and BACK. (KHIO-KCVO-KHIO) or (KLVK-KEDU-KLVK). You will need to know if you will need to refuel. To determine this. add up the fuel from BOTH navlogs, and compare it to the total fuel you can carry that day.
29 – Calculate True Heading
T.H. = T.C. + or – W.C.A
We obtained our Wind Correction Angle (WCA) in step #16. Now we apply (add or subtract) it to our True Course, to get our True heading.
30 – Calculate Magnetic Heading
M.H. = T.H. + or – Magnetic Variation
Now we will calculate Magnetic heading from our True heading by acounting for Magnetic Variation (this number should match our previously obtained magnetic heading).
31 – Note Magnetic Deviation
Almost all* trainer aircraft out there have a traditional magnetic compass. As such, these aircraft suffer from magnetic deviation. Deviation incorrect compass indication caused by magnetic fields generated by electrical wiring in the airplane (avionics…etc.). We need to use a compass deviation card to correct this error.
HOW TO READ A COMPASS DEVIATION CARD:
There are two kinds of compass deviation card…
In this first example, you need to find the heading nearest to your Magnetic Heading, and see below it the required adjustment, then apply it to M.H. Just like our calibrated airspeed chart.
In the second example, you need to simple apply the +/- value to the magnetic heading as depicted on the closest M.H.
*Aircraft with HSI’s or Magnetometers might not suffer from magnetic deviation, but most trainer aircraft are traditional six-pack.
32 – Calculate Compass Heading
Compass heading is what we will exactly point our nose to when we fly. To get our compass heading, we add or subtract our Magnetic Deviation from our magnetic heading.
33 – Note En-route Frequencies
The #32 boxes can be used for a couple things.
One thing we can use the tab to do is to identify radials of VORS which our checkpoints fall on, as a backup. We can write the frequency and radial, and the morse code identifier, in the upper and lower boxes.
Another useful thing to use the #32 boxes for is for approach, departure, and center control frequencies along route. To find the center frequency along flight, find an airport nearby the leg route. Then open the chart supplement to the nearby airport page, and find the “app/dept/ctr” frequency under “communications”
How do you choose what to put in this box? depends on the pilot and the route. If youre flying long distances in the vicinity of VORS, writing the VORS and radials might be more helpful. If its
34 – Departure and Arrival Airport Frequencies
Airport frequencies ar33 found on their respective chart supplement pages. many frequencies can also (more quickly) be found on the airport information block on the VFR sectional chart.
35 – Notes Section
Use the remaining space in the Navlog “notes” section to:
* Draw an airport sketch.
* Draw traffic patterns for each runway.
* Draw possible traffic pattern entries from direction of aproach.
* Write the name of the FBO and draw the approx. location.
* Draw / write available lights. Papi, Vasi?
* List relevant NOTAMS aswell!
Well done on sticking to the end. The most rewarding point awaits!
In flight, you will time between your checkpoints and write in the “actual time en route” (ATE) boxes and monitor if you are faster, or slower than you planned. This will help you gauge if you are burning less or more fuel then you planned.
It is normal, that your nav logs may take an hour or two to make, but with practice you will get faster with time. Practice making nav logs often to stay proficient!